Natural Product Efficacy Evaluation
Analysis of CA1, CA3, and DG areas of the hippocampus, substance-P, and brain-derived neurotrophic factors expression in the presence of Ocimum sanctum Linn on the brain of the rat model Alzheimer's disease
Analysis of CA1, CA3, and DG areas of the hippocampus, substance-P, and brain-derived neurotrophic factors expression in the presence of Ocimum sanctum Linn on the brain of the rat model Alzheimer’s disease
- 저자: Mataram MBA; Kustiati U; Wihadmadyatami H; Nugrahaningsih DAA; Salasia SIO; Kusindarta DL
- 출처: - (2025)
- DOI/링크: https://doi.org/10.5455/OVJ.2025.v15.i2.11
- 연구 계열: Topics/Natural Product Efficacy Evaluation
- 투고일: 2024-09-19
TL;DR
Ocimum sanctum 잎 에탄올 추출물(OSE)을 트리메틸틴(TMT)으로 유도한 알츠하이머병 래트 모델에 투여하자 해마 CA1, CA3, DG의 신경세포 수가 늘고 BDNF와 substance P(SP) 발현이 높았다. 저자들은 SP와 BDNF 발현 상향으로 신경세포 수가 늘어난 것으로 해석한다.
1. 연구 배경 및 동기
- 다루는 문제: 알츠하이머병(AD)은 인지 기능 장애와 이상 행동이 특징인 진행성 신경질환이며, 개 인지기능장애(CCD)는 11-12세 개의 28%에서 나타난다. AD와 CCD 모두 치료가 만족스럽지 않다.
- 기존의 공백 / 왜 필요한가: 질병 기전을 이해하고 동물모델로 새 치료제를 찾는 것이 중요하다.
2. 관련 연구
- 기존 연구 흐름: 아밀로이드-β 펩타이드의 축적이 신경독성과 중추신경계·신경전달물질 문제를 일으킨다.
- 이 논문의 위치: OSE가 AD 래트 모델 해마의 신경세포 수·형태와 신경영양인자 발현에 미치는 영향을 평가했다.
3. 핵심 기여
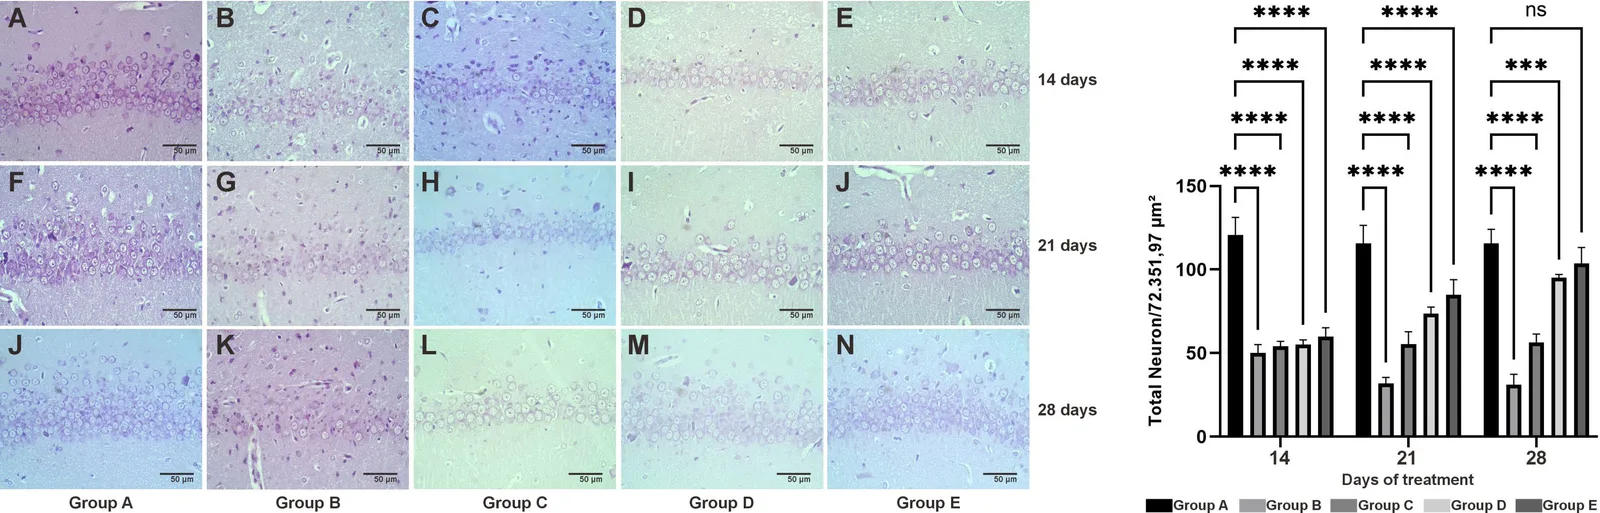
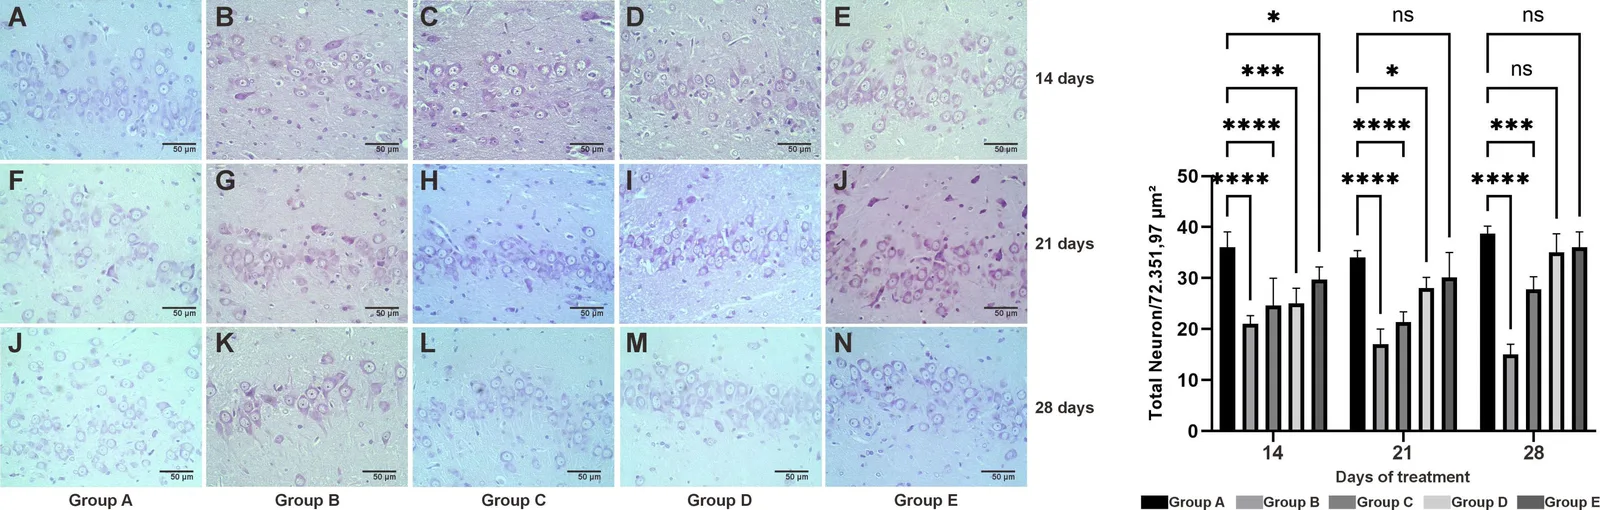
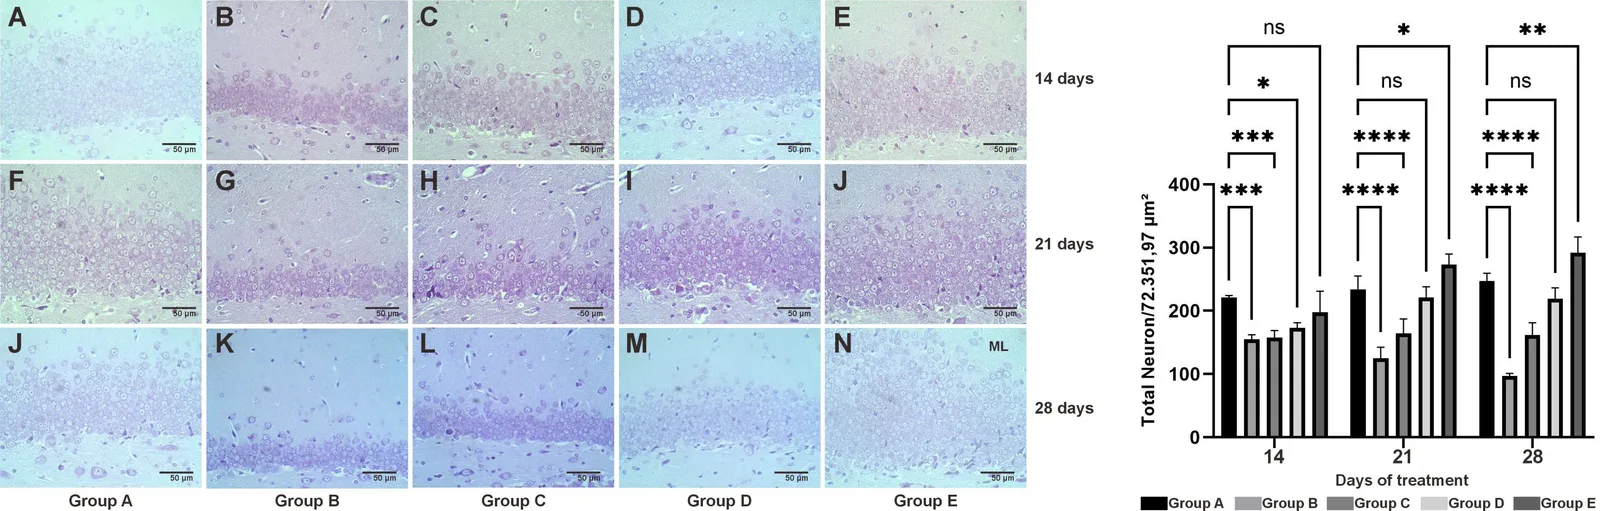
- OSE가 해마 CA1, CA3, DG의 신경세포 밀도를 높임을 제시
- BDNF 및 SP 발현 상향과 연결
4. 제안 방법론
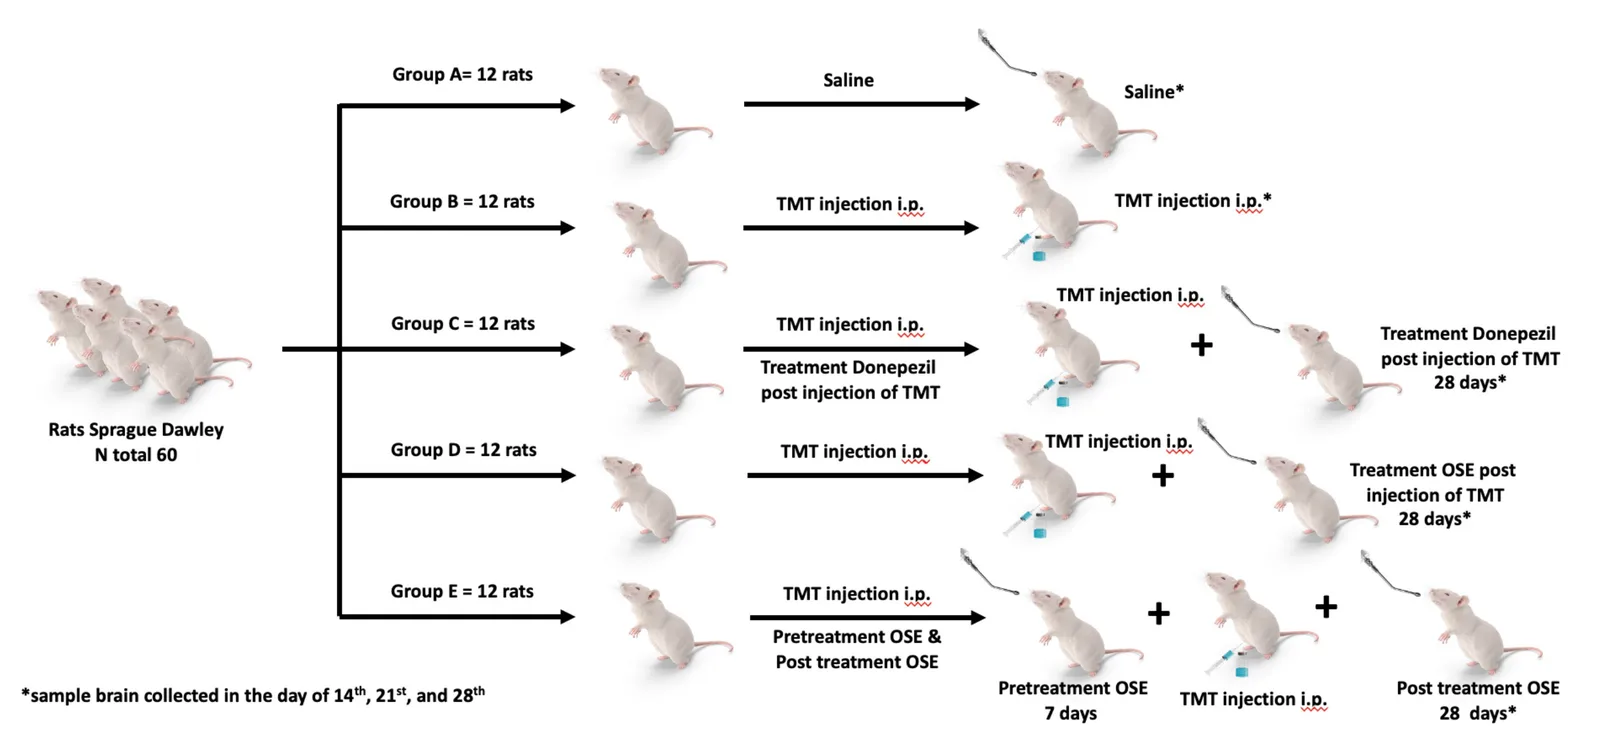
- 전체 접근 논리: TMT로 AD 모델을 만든 뒤 OSE를 투여하고 14, 21, 28일 시점에 해마 조직의 신경세포 수와 BDNF, SP를 분석했다.
- 단계:
- O. sanctum 잎 300 g을 96% 에탄올로 침출해 추출물 제조(수율 약 8.82%)
- Sprague Dawley 수컷 래트 60마리를 5군으로 나누고 TMT 8 mg/kg 복강 투여로 AD 모델 유도, OSE 100 mg/kg 경구 28일 투여
- 14, 21, 28일에 관류하여 해마를 채취, cresyl violet 염색으로 신경세포 수, SP 면역조직화학, BDNF ELISA 수행
5. 실험 설정
| 항목 | 내용 |
|---|---|
| 대상/재료 | Sprague Dawley 수컷 래트 60마리(200-250 g), 군당 n=12로 기재 |
| 처리 조건 | 군 A 생리식염수, 군 B TMT, 군 C TMT+donepezil(0.5 mg/kg), 군 D TMT 후 OSE, 군 E OSE를 1주 선투여 후 TMT 및 OSE 지속(100 mg/kg) |
| 대조군 | 생리식염수군(A), TMT군(B), donepezil군(C) |
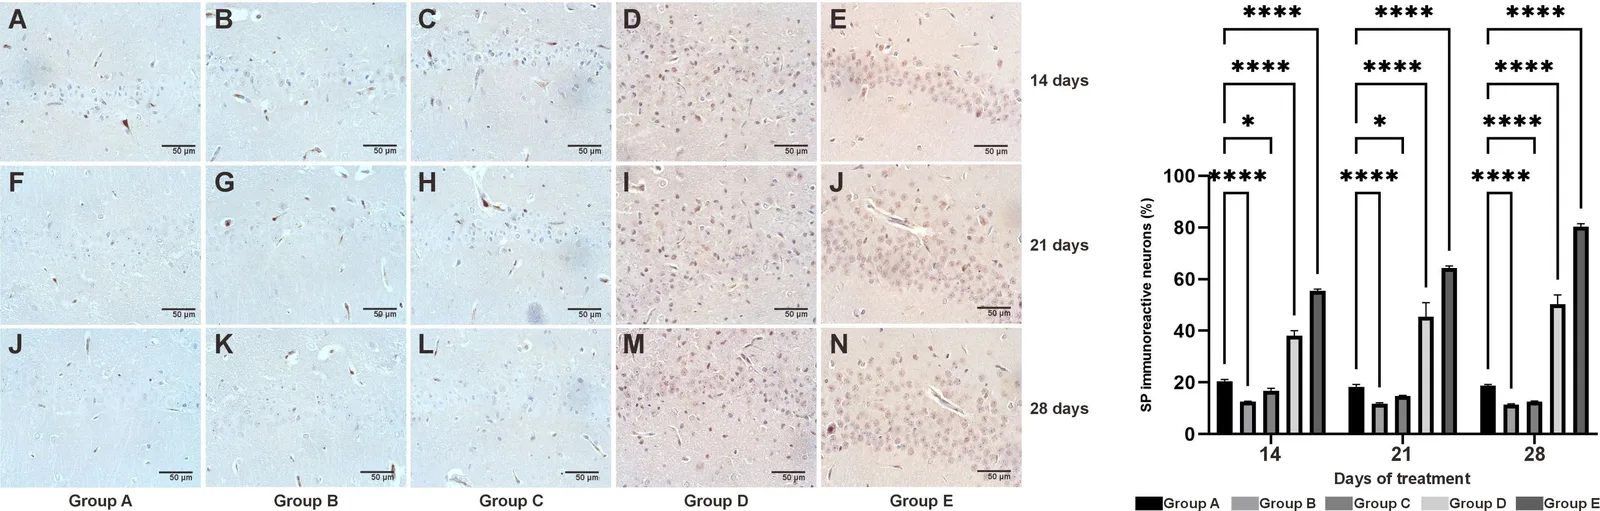
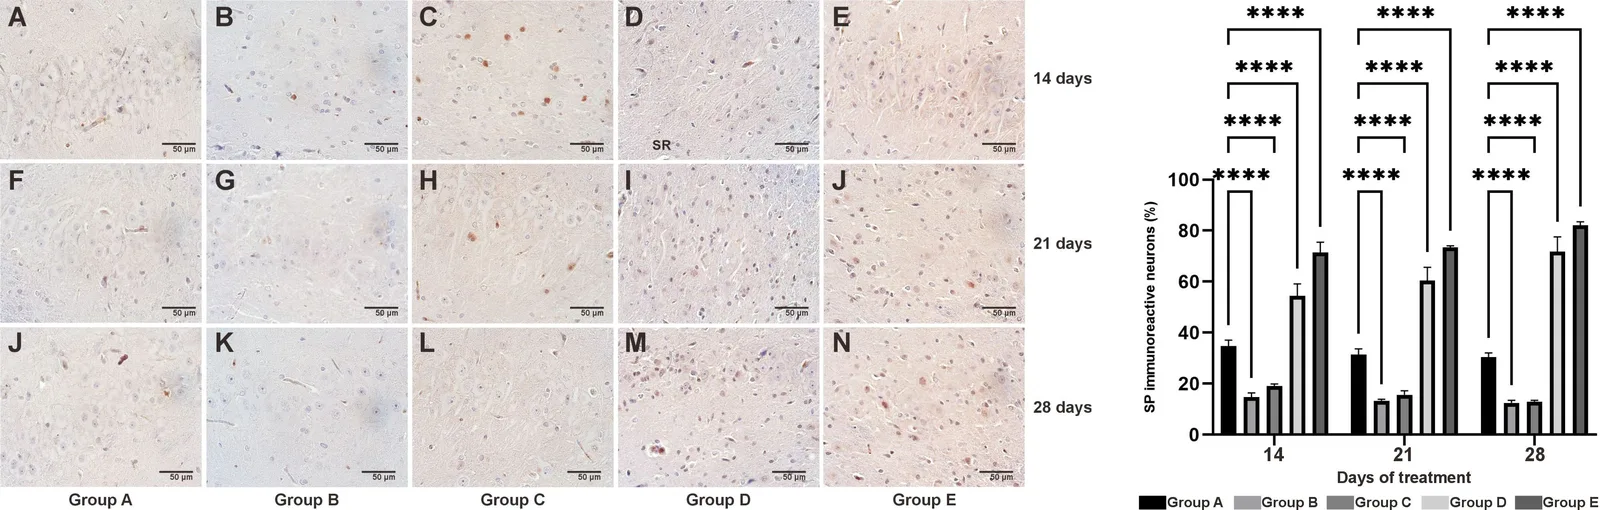
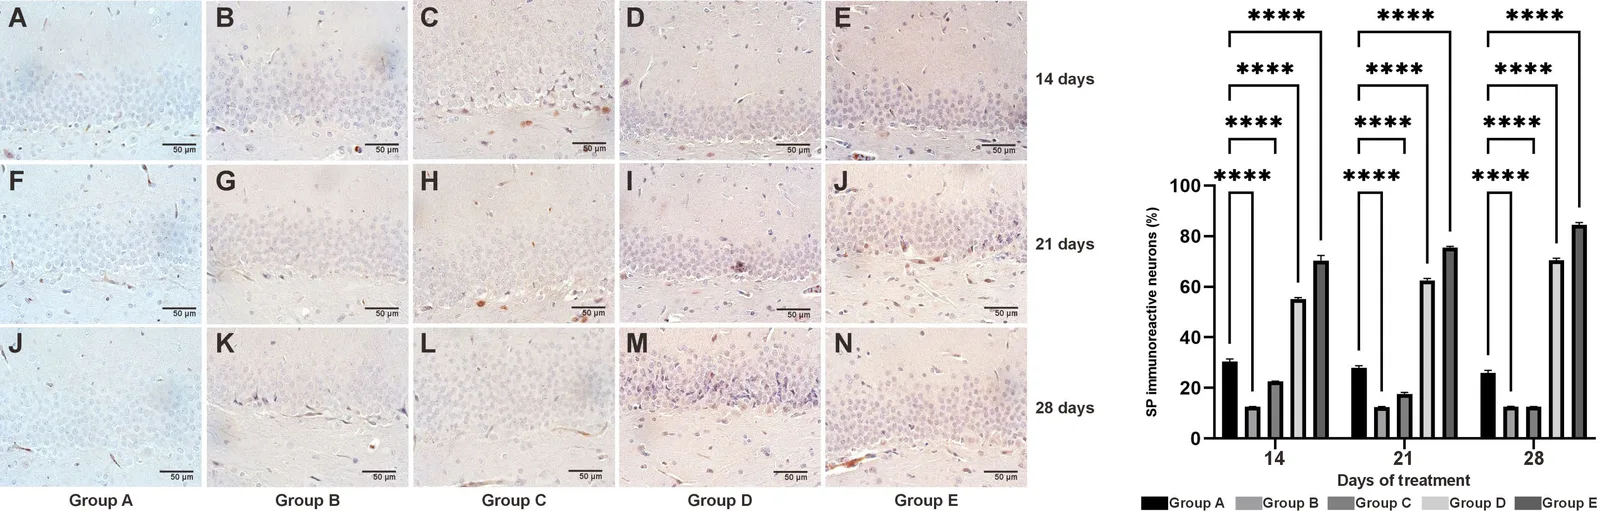
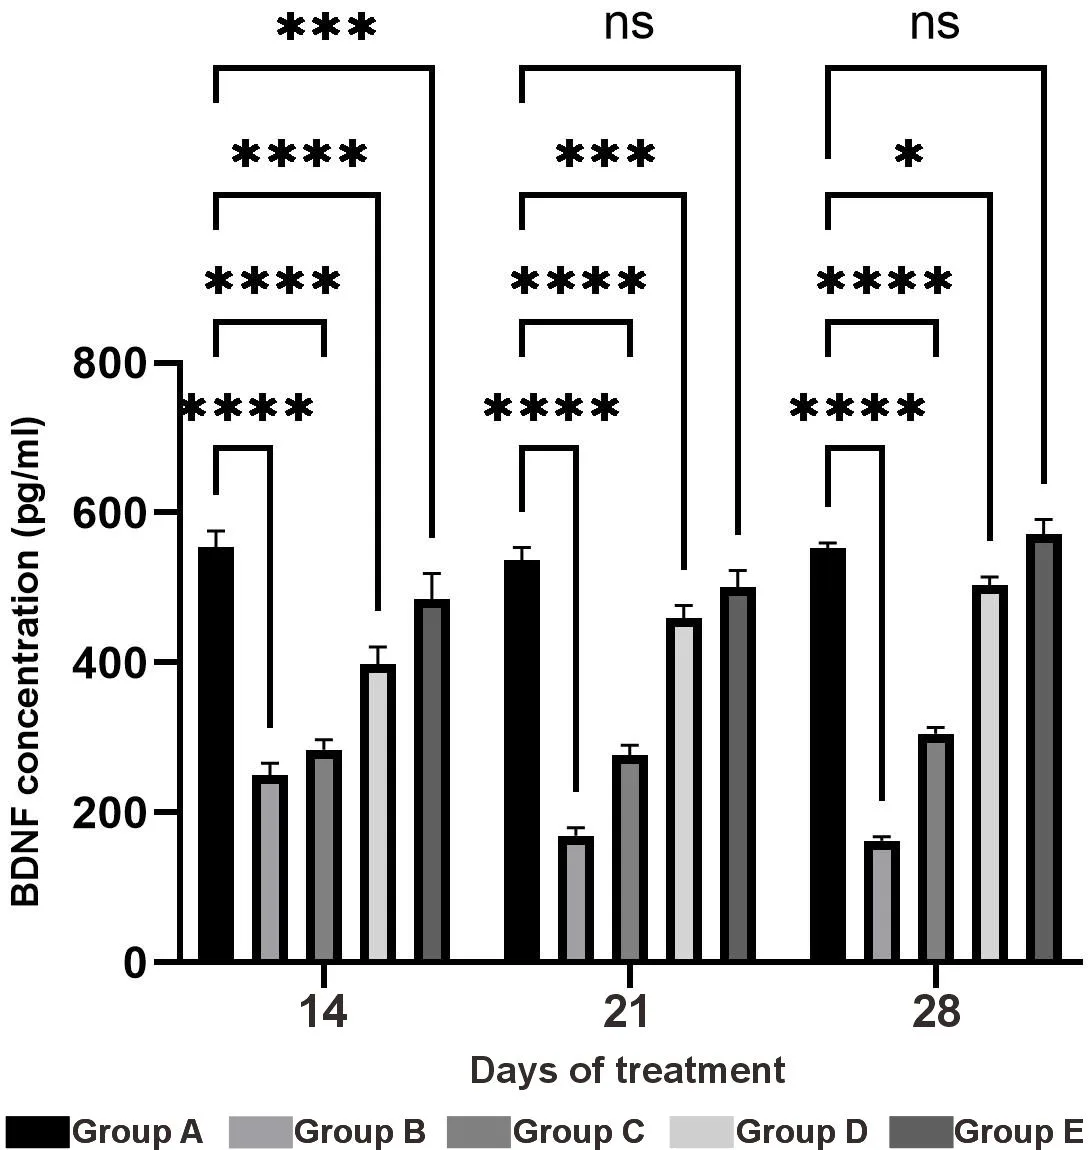
| 측정 방법 | cresyl violet 염색 신경세포 수(CA1, CA3, DG), SP 면역조직화학, BDNF ELISA |
6. 실험 결과 분석
| 지표 | 변화(Δ) | 조건 · 유의성 |
|---|---|---|
| 신경세포(피라미드·과립세포) 수 | CA1, CA3, DG에서 증가 | OSE 투여, 14-28일 |
| BDNF 및 SP 발현 | 상향 | OSE 투여 |
제안 기전(인과 사슬):
OSE → SP와 BDNF 발현 상향 → 해마 CA1, CA3, DG 신경세포 수 증가
7. 비판적 평가
강점
- 여러 해마 영역을 정량하고 donepezil 양성 대조군을 둠
- 3개 시점 분석
한계 · 의문
- 초록과 발췌에서 확인되는 통계 수치가 없음
- 행동 평가나 활성 성분은 확인되지 않음
- TMT 모델이 알츠하이머병을 완전히 대변하지는 않음
8. 향후 연구 방향
- AD와 CCD 치료제 개발을 위한 추가 연구
9. 결론
O. sanctum 에탄올 추출물은 AD 래트 모델 해마의 신경세포 수를 늘리고 BDNF와 SP 발현을 높였다. CCD를 포함한 치료 후보로서의 가능성을 시사한다.
Keywords
Ocimum sanctum, Alzheimer's disease, hippocampus, BDNF, substance P, trimethyltin, canine cognitive dysfunction
원문 그림
원문 그림 · 라이선스: cc-by-nc